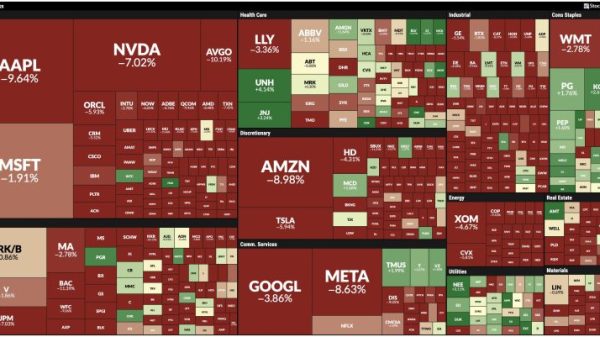
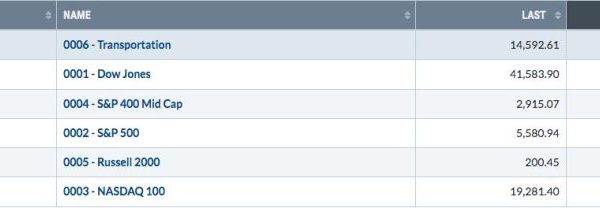
In this exclusive StockCharts video, Joe breaks down a new SPX correction signal using the monthly Directional Lines (DI), showing why this pullback could take time to play out. He explains how DI lines influence the ADX slope and how this impacts shorter-term patterns. Joe also reveals a strong area in the commodity market defying the correction and highlights top stocks within that sector. Plus, he analyzes QQQ and IWM, covering their recent weakness and key resistance levels, before analyzing viewer symbol requests for the week, including ADMA, CSCO, and more.
This video was originally published on March 19, 2025. Click this link to watch on Joe’s dedicated page.
Archived videos from Joe are available at this link. Send symbol requests to stocktalk@stockcharts.com; you can also submit a request in the comments section below the video on YouTube. Symbol Requests can be sent in throughout the week prior to the next show.


